
The rift in NATO has left many wondering about Europe’s ability to support Ukraine or even defend itself.
According to the most recent SIPRI data the USA’ military spending, of nearly a trillion dollars ($US997b), dwarfs the rest of NATO, who spent only $US507b.1 Nevertheless the rest of NATO’s defense budget is still much larger than Russia’s $US149b.
As noted by others, these figures, based on market exchange rates, potentially understate the real size of Russia’s defence budget. While it appears small in nominal terms it’s defence budget nevertheless supports an army of 1.7 million personnel – larger than the USA.
Taking into account these cost differences, and hence Russia’s overall military purchasing power, I estimate that Russia’s real defence budget equates to around $US400b, more than double the nominal market exchange rate estimate.
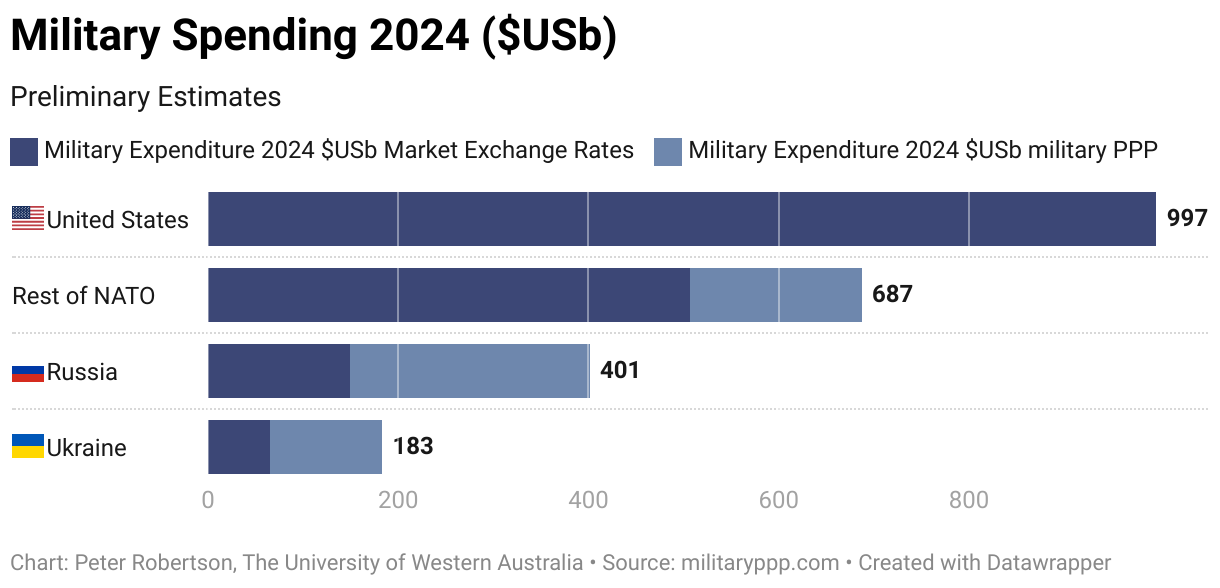
Nevertheless similar adjustments also apply to many European NATO countries. The undervaluation of the Euro, and lower costs in NATO countries such as Poland, Italy, Turkey and Spain, mean that European NATO’s overall budget has a purchasing power equivalent to $US687 billion.
So as shown in the figure, it is important to consider local costs when comparing across countries, and this matters for our assessment of NATO’s ability to offset Russia, support the Ukraine, sans the USA.
To understanding how different countries contribute to NATO in real terms we can look at spending in each country.
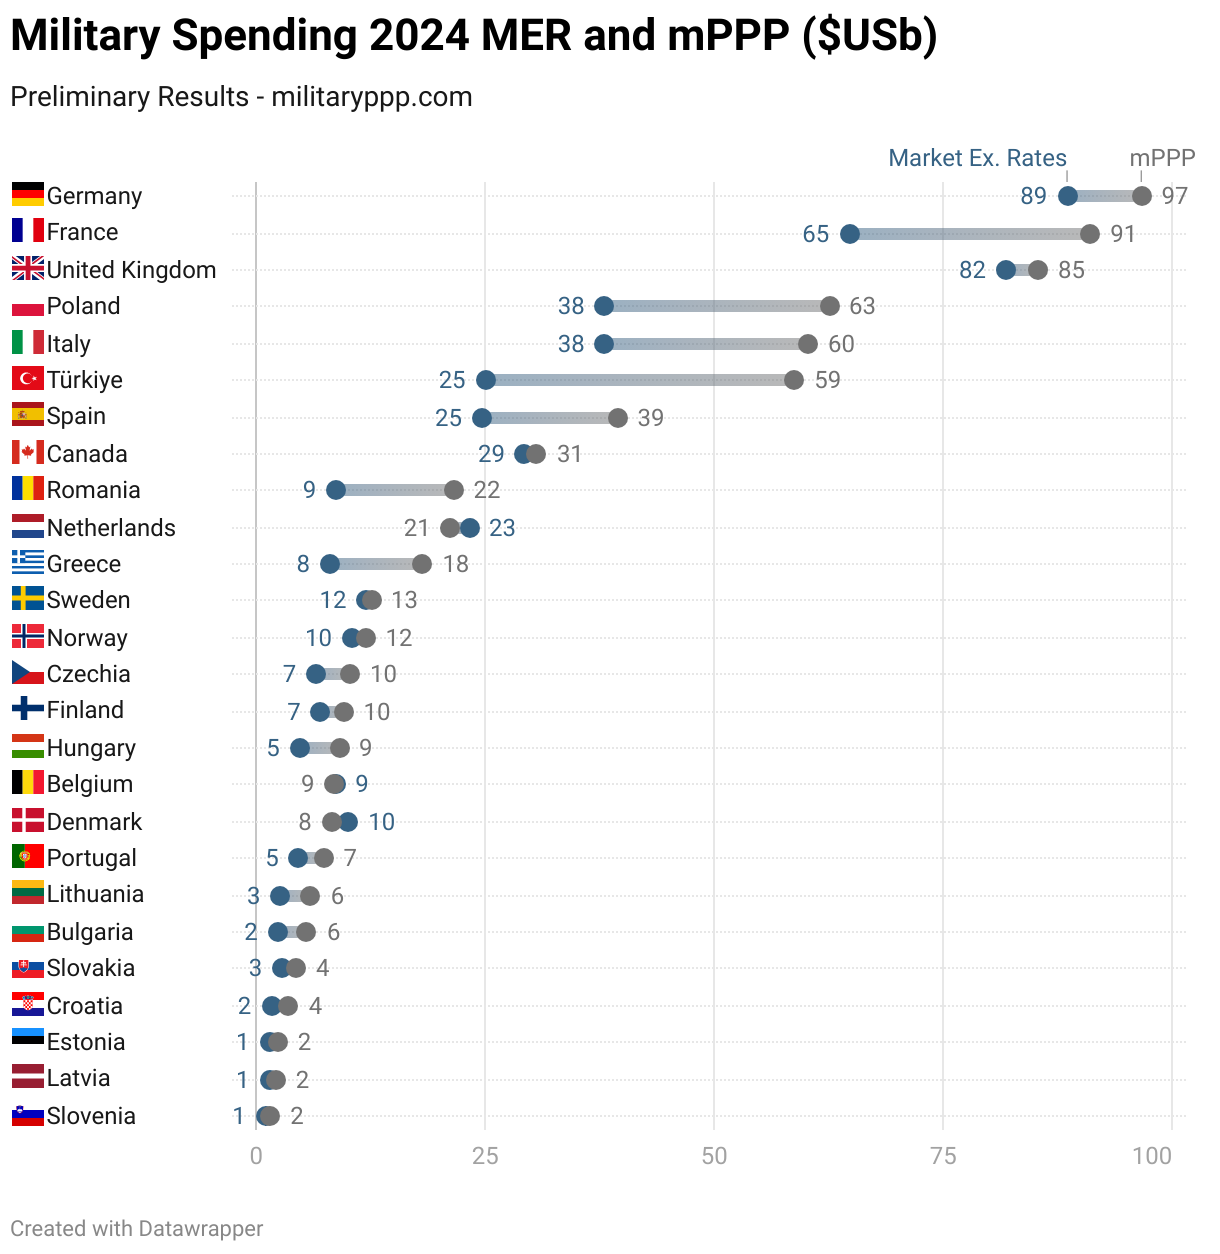
Poland, Italy Turkey, and Spain contribute substantially to the overall large PPP adjustment for European NATO. Similarly Romania Greece and many smaller countries, have larger armed forces than nominal military expenditure comparisons suggest. Costs also appear to be quite low in France compared to the USA, so its real budget is also significant larger than the nominal market exchange rate value.
The real picture, then, is that NATO is not as small relative to the USA as commonly depicted and that the rest of NATO is still substantially larger than Russia, even after military purchasing power adjustments.
This real spending comparison also offers a different perspective on what each country might contribute to NATO, even if each spends the same fraction of GDP.
- Note: data availability excluded Albania, Iceland, Luxembourg, Montenagro and North Macedonia. Included countries are shown in the graph of spending by NATO country. ↩︎
For data updates please subscribe.
